The soft drink market is one of the most competitive markets you can find. Consumers are drawn to new products and new flavours. Soft drinks are a multi-billion dollar market. Coca-Cola, Pepsi, and other big players in this market have been able to survive and thrive.
Soft drink sales stats are a great way to better understand the soft drink market and its growth. We take a look at recent sales statistics for different soft drinks and compile them together to give you an overview of the market. In this blog post, we look at recent soft drink sales stats.
Annual revenue of soft drink sales:
Soft drinks sales generated annual revenue of $0.79 trillion in 2022
$425.20 billion annual revenue has been generated alone in the US:
Soft drink sales in the US amounted to $425.20 billion in 2022.
The growth rate of soft drink sales:
The market of soft drinks is estimated to grow by 5.67% annually from 2022 to 2027.
$103.40 is per person revenue in 2022:
It is estimated that the total soft drinks per head revenue will be $103.40 in 2022.
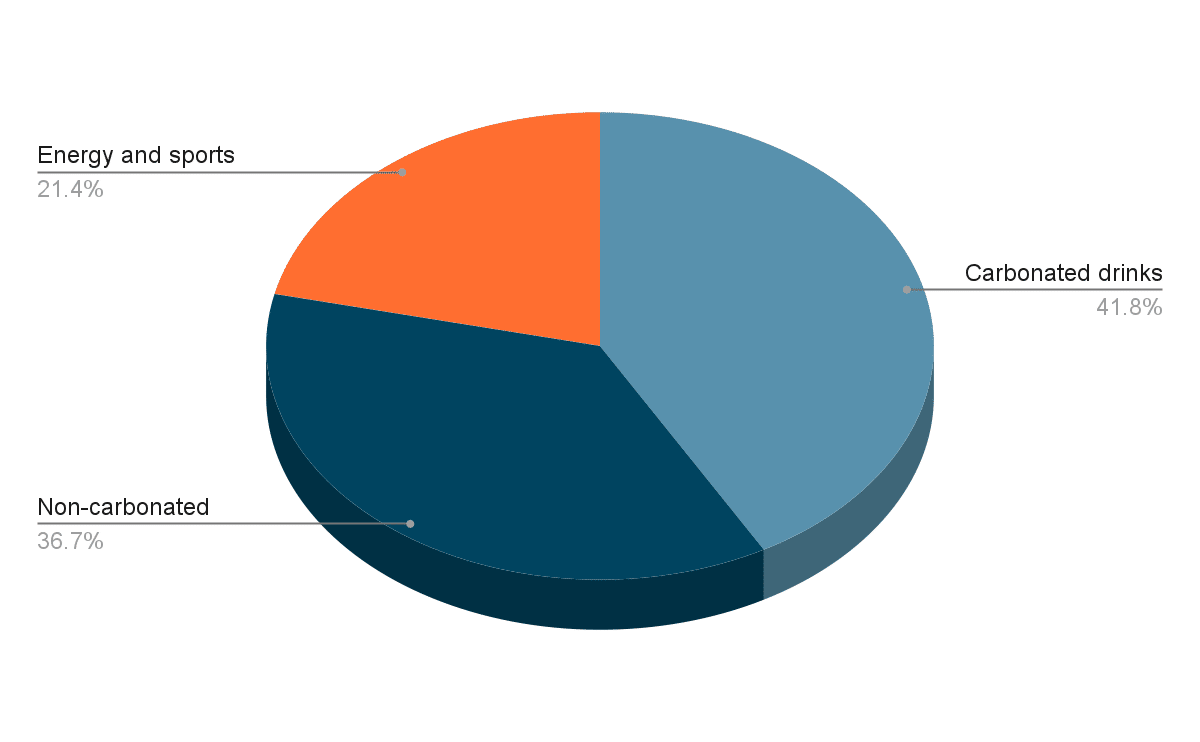
Annual revenue of soft drink sales by type:
$0.33 trillion is generated by carbonated drinks, with a total of $0.79 trillion in 2022
Energy and sports drinks generated $0.17 trillion in revenue in 2022
$0.29 trillion is the annual revenue of non-carbonated soft drinks in 2022
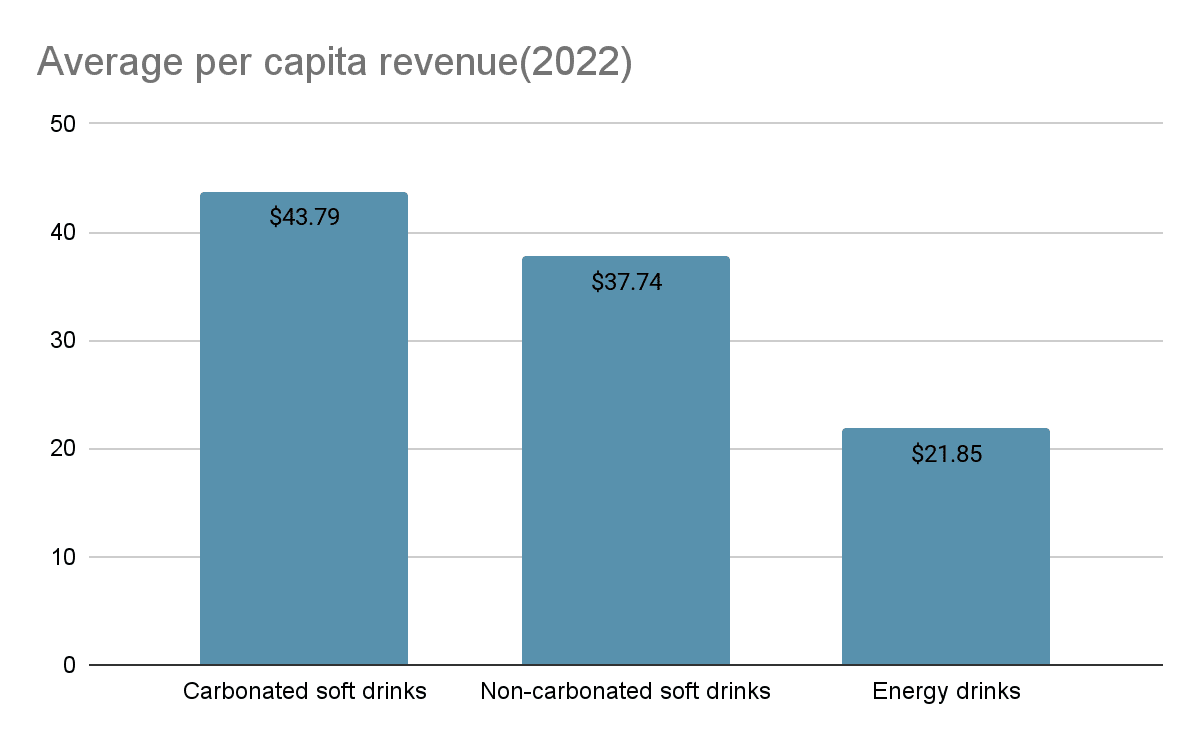
Average revenue per capita by soft drink type sales:
Carbonated drinks average revenue per capita in 2022 is $43.79
Non-carbonated soft drinks per capita average revenue is $37.74 in 2022
Energy soft drinks average revenue per capita is $21.85
Soft drink global market size:
The market size of soft drinks worldwide is $34.50 billion in 2022
In 2021 the global market size of soft drinks was $416.19 billion
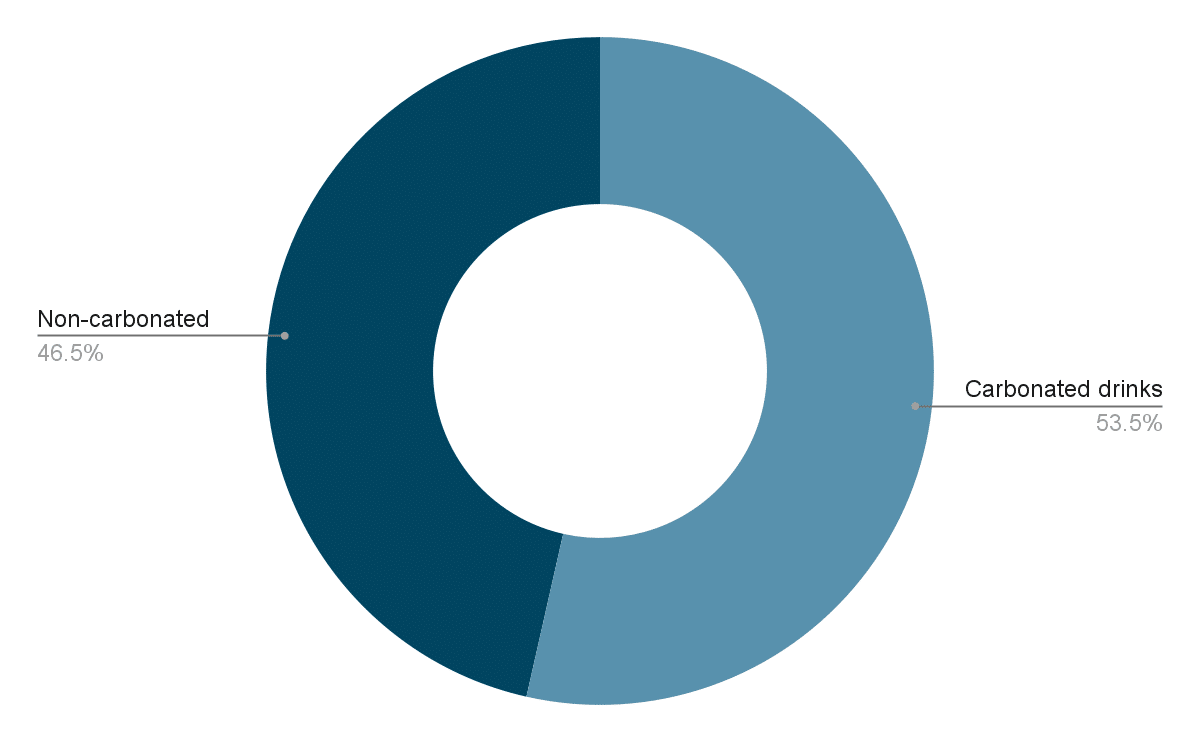
The market value of soft drinks: Carbonated versus non-carbonated drinks
The market worth of soft drinks as a whole was $742,235 million at the end of 2021 globally
Carbonated drinks market value was $394,179 million
Non-carbonated drinks market was $348,055 million in total.
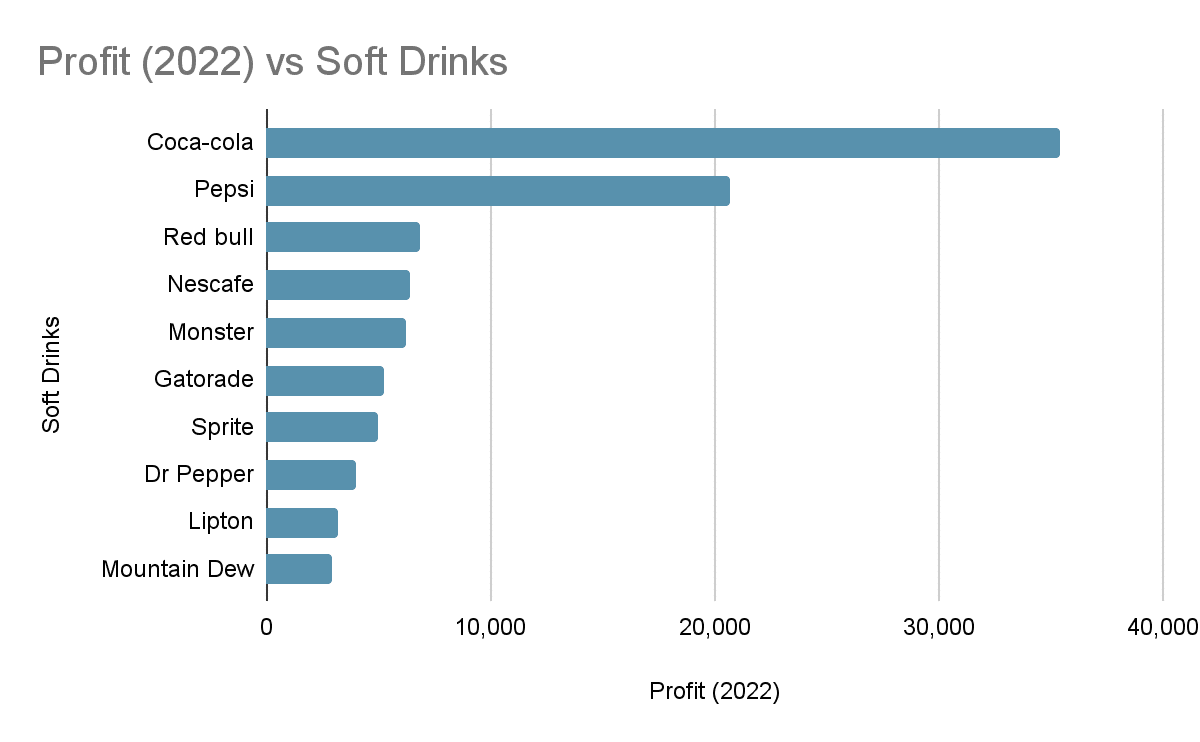
Top ten soft drinks by profit:
Coca-cola is the top brand of soft drinks, with a profit of $35,379 million in 2022. The following chart shows the top 10 soft drinks in terms of their annual profit (2022):
Here are the exact values:
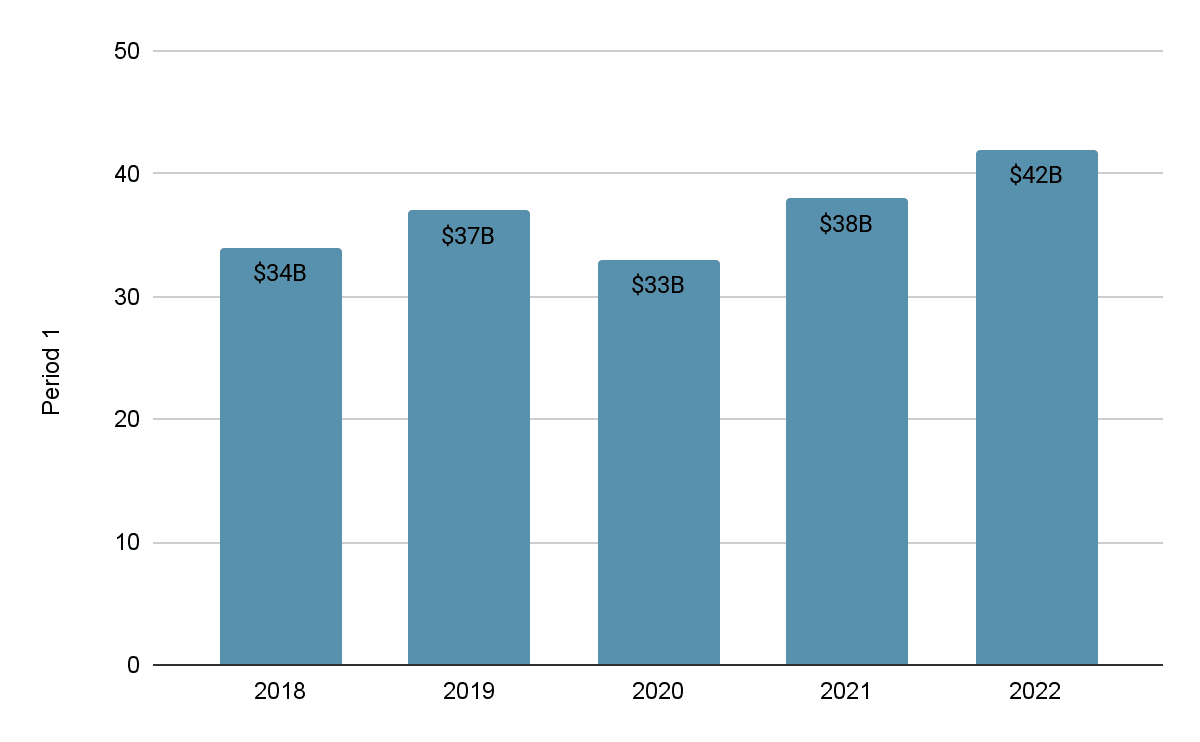
Coca-cola is the most-sold soft drink with $42 billion annual revenue in 2022:
Coca-cola’s annual revenue for 2022 is $42 billion, with a 12% increase from the previous year
In 2021 its annual revenue was $38 billion
Here is the visual analysis of coca-cola annual revenue in the last five years:
Men buy more soft drinks than women:
According to a survey, men of all age groups drink soft drinks more than women. Men who are daily consumers drink about 825ml of sugary drinks in a day.
12-24 years of age drink more soft drinks:
Young males between 12 and 24 years drink soft drinks daily or 2-3 times a week. Coca-cola is the favourite of the age group between 35-44 years.
42.54L is the average volume of soft drinks per person in 2022:
The average volume of soft drinks consumed by each person in 2022 is estimated to be 42.54 litres.
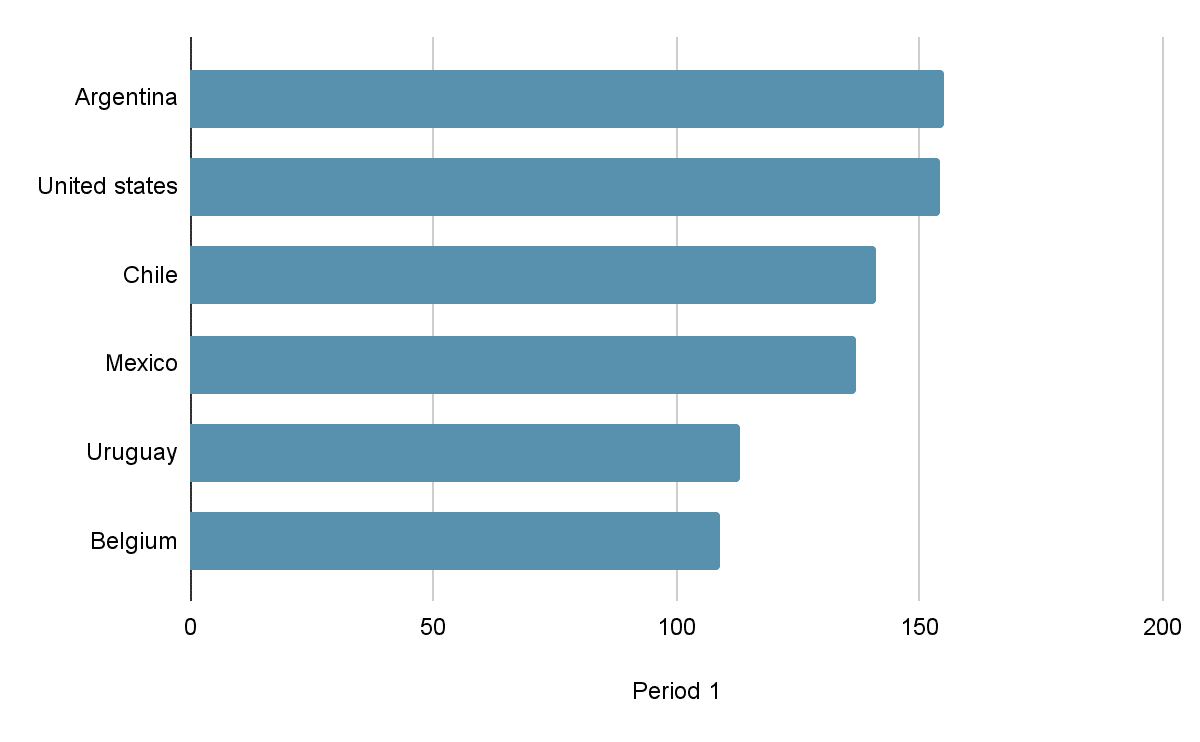
Top six countries where soft drinks are consumed the most:
Soft drinks are mostly consumed in Argentina, with 155 litres per capita yearly. The second number is the united states. The following graph shows the visual analysis of soft drinks consumption in six countries by litres per capita consumed each year: